This integration requires a UTMStack agent to work properly. Please, make sure you have installed it before you continue.
Kibana is a free and open user interface that lets you visualize your Elasticsearch data and navigate the Elastic Stack. Do anything from tracking query load to understanding the way requests flow through your apps.
1. Enable Filebeat module
Linux
cd /opt/utmstack-linux-agent/beats/filebeat/ && ./filebeat modules enable kibana
Windows
cd "C:\Program Files\UTMStack\UTMStack Agent\beats\filebeat\" && filebeat modules enable kibana
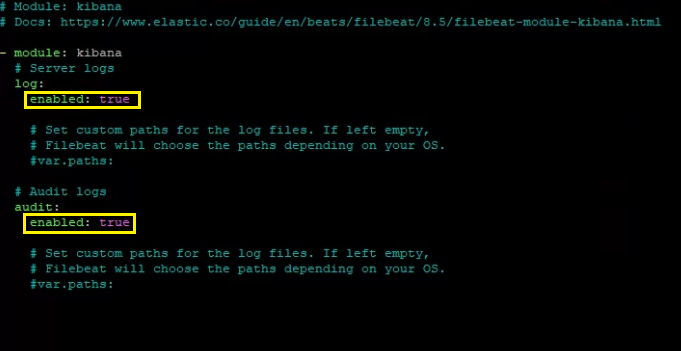
Configure the module configuration file according to the image below. You can find it in the path:
Linux
/opt/utmstack-linux-agent/beats/filebeat/modules.d/kibana.yml
Windows
C:\Program Files\UTMStack\UTMStack Agent\beats\filebeat\modules.d\kibana.yml
Important!! After a Filebeat module is enabled, the service needs to be restarted using the following command:
Linux
sudo systemctl restart UTMStackModulesLogsCollector
Windows
sc stop UTMStackModulesLogsCollector && timeout /t 5 && sc start UTMStackModulesLogsCollector
Depending on how you’ve installed Filebeat, you might see errors related to file ownership or permissions when you try to run Filebeat modules. See Config File Ownership and Permissions In order to this integration work properly, you must configure the kibana logs and audit logs appender, to generate logs in json format. For more information visit: Logging configuration and Audit logs